Stock Prices
Display real-time stock prices and percentage changes from Yahoo Finance with color-coded gain/loss indicators.
Overview
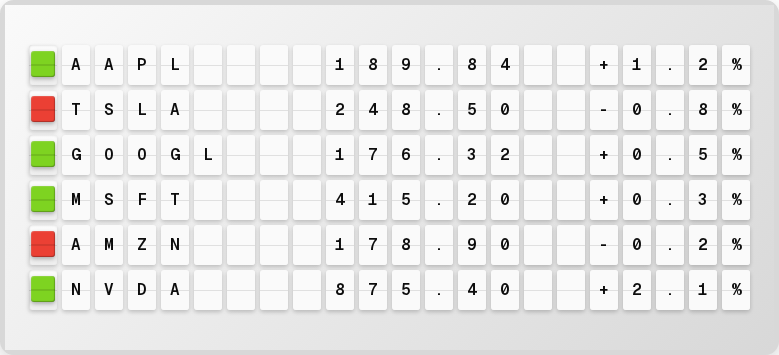
The Stock Prices plugin shows:
- Current price for up to 5 symbols
- Percentage change (configurable time window)
- Color-coded: green for gains, red for losses
- Company names
Setup
- Open http://localhost:4420
- Go to the Integrations page
- Toggle Stock Prices on
- Use the symbol picker to add up to 5 stock symbols
- Choose your time window for change calculation
- Click Save Changes
tip
No API key is required for stock data. An optional Finnhub API key enables better symbol search -- get one free at finnhub.io.
Available Variables
| Variable | Description | Example |
|---|---|---|
{stocks.formatted} | Pre-formatted stock line | AAPL 189.84 +1.2% |
{stocks.symbol} | Stock symbol | AAPL |
{stocks.current_price} | Current price | 189.84 |
{stocks.change_percent} | Percentage change | +1.2 |
{stocks.change_direction} | Direction | up |
{stocks.company_name} | Company name | APPLE INC |
{stocks.symbol_count} | Number of tracked symbols | 5 |
Color Coding
Stock prices are automatically color-coded:
- Green (
{66}) for positive changes - Red (
{63}) for negative changes
Time Windows
| Option | Description |
|---|---|
| 1 Day | Previous trading day close |
| 5 Days | 5 trading days ago |
| 1 Month | ~22 trading days ago |
| 3 Months | ~66 trading days ago |
| 6 Months | ~132 trading days ago |
| 1 Year | ~252 trading days ago |
| 2 Years | ~504 trading days ago |
| 5 Years | ~1260 trading days ago |
| ALL | Since earliest available data |
Next Steps
- Plugins Overview -- See all available plugins
- Color Guide -- Learn about color formatting